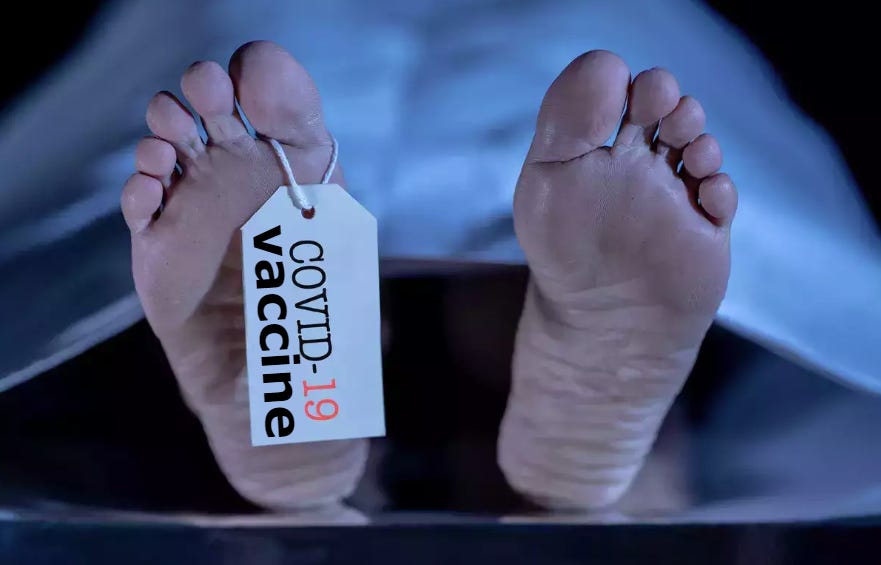
Vaccine Injury Data Is Clear: COVID Vaccines Are Killing an Estimated 1 Person Per 1,000 Doses (676,000 Dead Americans)
Vaccine Injury Data Is Clear: COVID Vaccines Are Killing an Estimated 1 Person Per 1,000 Doses (676,000 Dead Americans)
It is the greatest medical crime in human history.
Australian Senator Malcolm Roberts:
Senator says those who said “safe and Effective” were lying and “that is malfeasance, deliberate ignorance to maintain the safe and effective lie”
“1 in 35 recipients of a Moderna Covid booster experienced Myocarditis”
“safe and effective were two lies”
“Deaths rose with vaccination rates”
“30,000 excess deaths in the last 12 months are in part caused caused by these injections” ” Excess deaths in Australia are 27% above expected levels”
“turbo Cancer caused by the Covid vaccine”
VAERS data is crystal clear: The COVID vaccines are killing an estimated 1 person per 1,000 doses (676,000 dead Americans)
It takes about 30 seconds to do a VAERS query that shows the COVID vaccines are deadly. The shape of the “onset curve” makes this obvious. An estimated 676,000 Americans have been killed.
By:Steve Kirsch, Aug 6, 2023
Executive summary
72% of the IUS death reports in the 33 year history of VAERS are from one vaccine: the COVID-19 vaccine.
Unlike other vaccines, the COVID vaccines keep on killing people, for months and years after the shot.
The statistics I’ve been able to collect estimate that the COVID vaccines kill 1 person per 1,000 doses. These vaccines aren’t close to safe, so we don’t even have to get into a discussion as to whether they are effective.
They are clearly unsafe and nobody should be taking them.
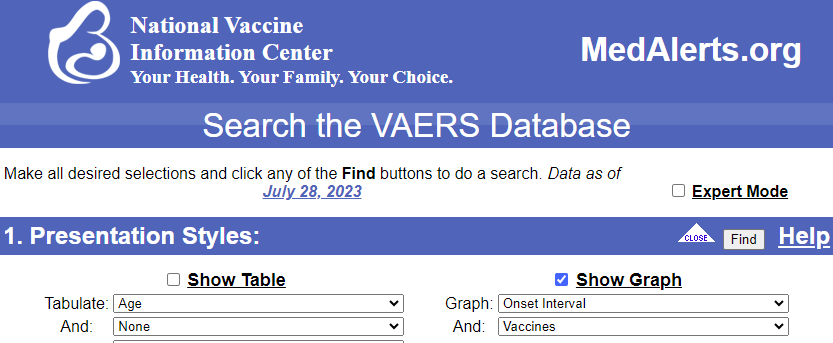
And we can prove that with one VAERS query which nobody can explain away. Anyone can replicate this themselves.The VAERS queryGo to medalerts.org, and set the parameters are follows:
- Graph the Onset Interval and Vaccines
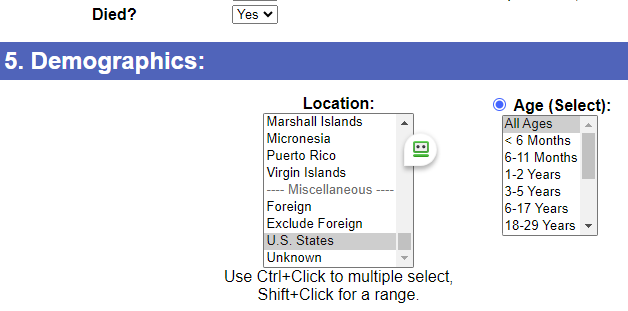
- Died: Yes
- Demographics: US states
VAERS resultThe line with all the deaths is the COVID vaccine.Found 16,396 cases where Location is U.S. States and Patient Died
VAERS data is crystal clear: The COVID vaccines are killing an estimated 1 person per 1,000 doses (676,000 dead Americans)
It takes about 30 seconds to do a VAERS query that shows the COVID vaccines are deadly. The shape of the "onset curve" makes this obvious. An estimated 676,000 Americans have been killed.

Executive summary
72% of the IUS death reports in the 33 year history of VAERS are from one vaccine: the COVID-19 vaccine.
Unlike other vaccines, the COVID vaccines keep on killing people, for months and years after the shot.
The statistics I’ve been able to collect estimate that the COVID vaccines kill 1 person per 1,000 doses. These vaccines aren’t close to safe, so we don’t even have to get into a discussion as to whether they are effective.
They are clearly unsafe and nobody should be taking them.
And we can prove that with one VAERS query which nobody can explain away. Anyone can replicate this themselves.
The VAERS query
Go to medalerts.org, and set the parameters are follows:
Graph the Onset Interval and Vaccines
Died: Yes
Demographics: US states
and
VAERS result
The line with all the deaths is the COVID vaccine.
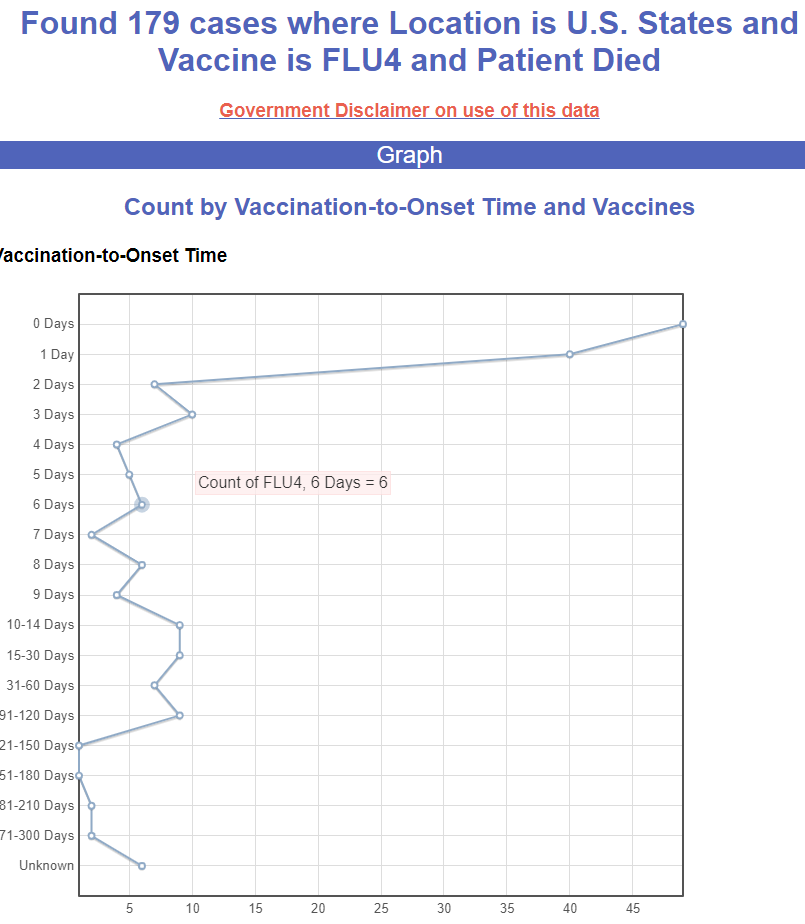
Found 16,396 cases where Location is U.S. States and Patient Died
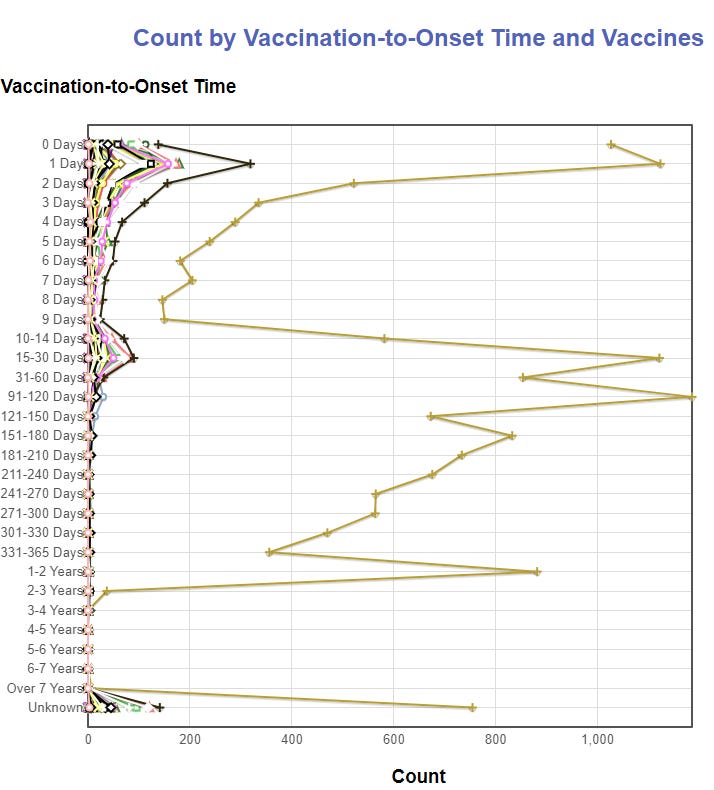
What does this mean?
It means that the COVID vaccines are killing people.
The onset interval is the interval from the time of vaccination until the first symptoms occurred. Since we are looking at death reports, these will be the time until the first symptoms preceding the death appear or, in many cases, the elapsed time until the death itself.
A safe vaccine should have a peak near day 0 just due to coincidence causing false reports in the first few days after the vaccine as people falsely associate the death event with the date of vaccination. The rest of the curve should be flat. This is the case for many of the vaccines. For example, the Rubella vaccine doesn’t have a single death report in the history of VAERS (but does have 800 adverse event reports).
The flu vaccine (FLU4) has an onset curve for deaths that looks like this, but keep in mind that the FLU4 vaccine can be given with other vaccines in the same visit, so it’s hard to separate out just the effect of the FLU4 vaccine, but the point is that if vaccines are safe, the death rates reported after the vaccines should be perfectly flat since deaths are random with respect to a vaccination date.
What you can see from Figure 1 above is that the COVID vaccines don’t look at all like a safe vaccine: the peaks of deaths just keep going and going. The peaks end after 2.5 years because the COVID vaccines have only been out for 2.5 years.
In particular, note that:
the peak at 90-120 days is larger than the peaks at 0 and 1 days
the peak at 15-30 days is nearly as high as the peaks at 0 and 1 days
the peak at 1-2 years is unprecedented
For the COVID vaccine, it’s not even close to that.
Many other vaccines show a death peak 15-30 days out. This is clearly caused by the vaccines. In other words, many of the vaccines the CDC believes are safe are, in fact, killing people.
72% of the deaths in the history of VAERS are from the COVID vaccine
VAERS queries show:
Found 11,860 cases where Location is U.S. States and Vaccine is COVID19 or COVID19-2 and Patient Died
Found 16,396 cases where Location is U.S. States and Patient Died
This is 72.3% of all deaths are from the COVID vaccines. This is extraordinary. The sheer number of deaths here as well as the onset interval above, are clear evidence we have the most deadly vaccine in US history that we are forcing people to take.
Death rate from the COVID vaccine: 1 per 1,000 doses
I’ve written in the past about the death rates from the COVID vaccine.
Recently, Denis Rancourt looked at large population data in Australia and Israel and estimated a rate of 1 death per 1,000 doses (see page 23: “… it is not unreasonable to assume an all-population global value of vDFR = 0.1%).
My estimates agree with this. In fact, just recently, I heard Jay Bonnar’s anecdote which confirms this. Jay had 15 friends, all vaccinated, die unexpectedly. There were about 14,000 vaccines given to his friends. So his story is right in line with my 1 in 1,000 estimate. I’ll be writing about Jay in my next Substack.
From VAERS, we have a minimum of 11,500 excess deaths (assuming we only count deaths that we know for sure were in the US) and an under-reporting factor of 41, we get 471,000 vaccine-caused deaths at a minimum (since 41 is the best case under-reporting factor). This conservative estimate is a death rate of 1 per 1,400 doses, which is lower than my 1 in 1,000 best estimate.
But if we use a more realistic value of 17,729 deaths (where we exclude foreign deaths which are typically well identified), subtract out 500 “coincidental” deaths, 17,529*50 (where 50 is a more realistic factor for deaths since 41 was for the very best case of anaphylaxis), we get 876,000 deaths from 676M COVID vaccine doses administered, which means the death rate estimated from VAERS is that we are killing 1.3 people per 1,000 doses (i.e., we are killing 1 person for every 770 doses).
We can also look at independent surveys that have not been retracted in the peer-reviewed literature because they weren’t published in the peer-reviewed literature.
To date, there has only been one independent survey (by Rasmussen) that has ever been done comparing COVID death counts to COVID vaccine death counts. So I’m not cherry picking… this is the ONLY survey. The Rasmussen survey found that a comparable number of people died from the vaccine as from COVID. My own surveys, done by independent polling firms using their lists, not mine, found exactly the same thing: the vaccine has killed as many people as COVID. There are 1.1M cumulative deaths from COVID. But probably half of those are people who died with COVID, so maybe 600K true COVID deaths. So this suggests around 600,000 vaccine deaths which is very close to my 1 in 1,000 doses estimate.
We can also look at excess death rates in places likely to have good counts, high vaccination rates, and not in the public eye such as the province of Alberta. The data shows all-cause mortality jumped by 20% from 2019 vs. 2021. If half of that was COVID and half was the COVID vaccine this would match the predicted 10% increase in all-cause mortality caused by the vaccine.
Another clue is to look at COVID death rates post vaccine to see if the vaccine might be saving lives. These rates should have dropped after the vaccine rolled out if the vaccines worked. Yet COVID hospitalizations in Ontario were up by 31% in 2022 and deaths were up by 39% in 2022. But the variants were less deadly. COVID deaths were around 7% of overall deaths.
So I’ll stick with my more conservative 1 death per 1,000 doses and I feel pretty good about that being a pretty good estimate. It’s nearly midway between the two VAERS estimates as well ((471+876)/2=674K deaths)! And it’s also very close to the number Mark Skidmore got from his surveys before they unethically retracted his paper (Skidmore just looked at 2021 deaths in his estimate of 278,000 people for COVID vaccine deaths the first year).
Huh? Why wouldn’t this have shown up in the clinical trials with 22,000 people in the treatment arm?
If the COVID vaccine was killing 1 person per 1,000 doses over 2 years, then 44 people should have died unexpectedly in the Pfizer trial in the vaccine arm. In a 6 month observation period, this would amount to 11 excess deaths in the vaccine arm, but there were only 4 excess deaths in the vaccine arm assuming they were able to track all the deaths accurately.
There are several explanations for this:
A 0.1% overall increase in all-cause mortality (ACM) is an overall 10% increase is base rate ACM. Nobody’s going to notice a change this small. This is what makes this vaccine so insidious: the death rate is just below the “notice” threshold.
In the Pfizer trials, there were 21 deaths in the vaccine group and 17 in the placebo group (see this article). My conservative estimate was 10% increase in ACM, but a 23% increase was observed. So my estimate looks conservative. Also, there were 4 cardiac deaths in the vaccine group vs. 1 in the placebo group. Three excess cardiac deaths on a base of around 20 deaths is a 15% increase. So using this metric as well, we appear to be “in range” on our 1 per 1,000 estimate. Even though this could be interpreted as causing 22 deaths in the vaccine arm, the 1 in 1,000 should be interpreted as a 10% increase in ACM which in this case was very low (it was a 6 month study in a very healthy group who died at a rate much lower than the general population). Jay Bonnar, who knows around 5,600 vaccinated people had 15 deaths from the vaccine over 2.5 years which is 3 deaths in a 6 month period. The clinical trial had 4X as many people, so we’d expect to see 12 deaths from the vaccine.
It wasn’t the same vaccine that was used in the trials vs. in commercial production. The commercial vaccines were more dangerous and had a variation in the lethality mix.
They may have undercounted the deaths because some were lost to follow up. How hard did they try?
The lack of a single success anecdote should be very troubling to everyone
If the vaccine really work to reduce all-cause mortality (ACM), it should be EASY to find a geriatric medical practice where the ACM of the vaccinated is lower than the ACM of the unvaccinated; it should be nearly 100% of all practices in the US. But so far, I've been unable to locate even a single one. Weird, isn't it?
Here’s my latest attempt:

Summary
A simple VAERS query on the COVID vaccines for death and looking at the onset interval makes it immediately obvious to anyone that the COVID vaccines are the most deadly vaccines in the 33 year history of the VAERS system. Nothing else is even close.
The people who work at the CDC are paid to look the other way and mislead America into thinking the COVID vaccines are safe.
There is no possible way these vaccines are safe. In my next article, I’ll talk more about the Jay Bonnar case and I’ll make this crystal clear to everyone.


Comments
Post a Comment